Deer and Turkey Habitat
A map of which ground looks best for deer and turkeys, and how far to trust it.
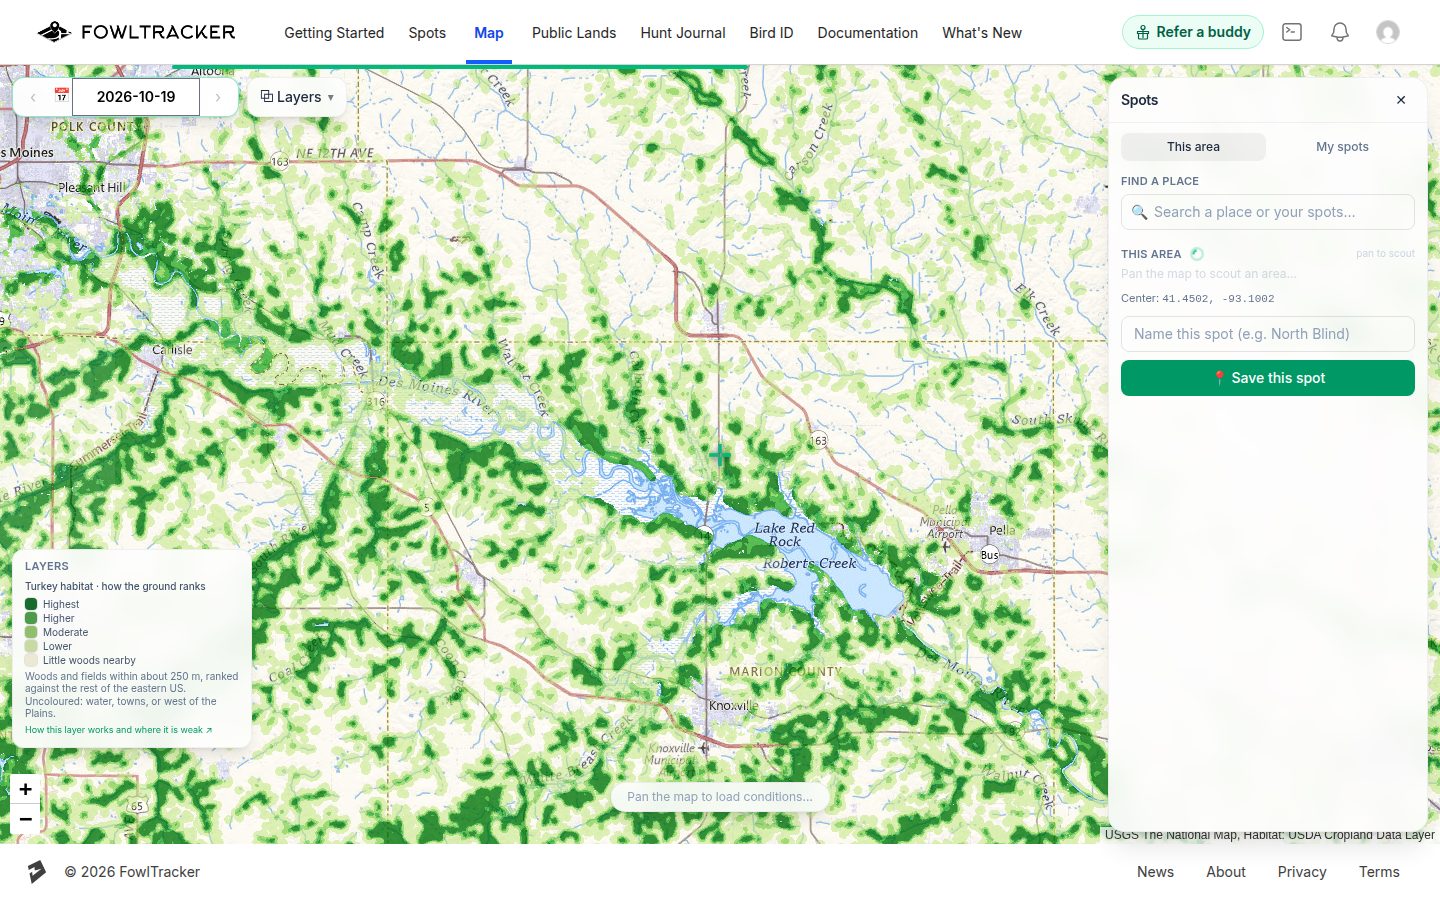
The Deer habitat and Turkey habitat layers colour the map by how the ground ranks for each animal: darker green is better. They are in ⧉ Layers under Hunting ground, one at a time, and each adds its own key to the bottom-left of the map.
Read them as a scouting aid for the ground, not a forecast. They do not know where animals are today, and they do not know about hunting pressure, food plots, access or what the landowner allows.
How to read the colours
- Highest, Higher: the better half of the ground that has woods nearby, compared across the eastern US.
- Moderate, Lower: ordinary ground for that animal.
- Little woods nearby (faint cream): open farmland or grass with no woods within about 250 m.
- No colour: not rated. That is open water, towns, and everything west of the Great Plains.
The ranking is relative. “Highest” means high compared with the rest of the eastern US, not a promise about any one spot.
What the score is built from
For every 30 m square we look at the 250 m circle around it in the USDA's Cropland Data Layer, which says whether each square is woods, field, crop, water or developed. We then score the mix: a good amount of woods with open ground or crops right next to it ranks high. Solid timber ranks lower than woods broken up by fields, and bare fields rank lowest. Turkeys are scored for a slightly more wooded mix than deer.
The data is a snapshot of recent crop years and updates when we rebuild the layer, not during the season.
How well it works
We tested the ranking before shipping it, against places animals were actually found rather than where hunters happened to harvest them: GPS collars on deer and turkeys and trail-camera detections across the country. Honest summary:
- Turkey: a real but moderate signal. Locations where turkeys were found ranked higher than random ground more often than not.
- Deer: a real but smaller signal. Deer use almost everything, so habitat alone separates good from poor ground less sharply.
- Strongest: farm-and-woodlot country, where fields and woods are mixed. Weakest: large unbroken forest, towns and suburbs, and the arid West (which is why it is not rated).
So use it to narrow a big area down to places worth a look, then trust what you see on the ground over the colour.
With your saved spots and hunt journal
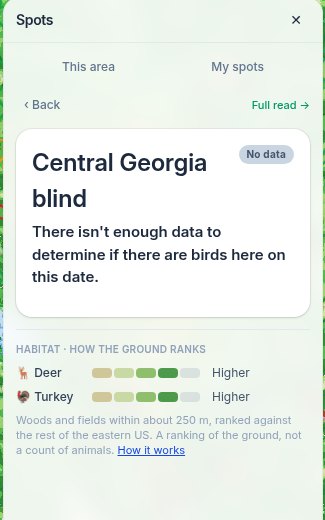
- Scout tab: with a habitat layer on, the “This area” panel shows the meter for the centre of the map next to its roost read.
- Saved spots: opening a spot on the map, and each spot's own page, show both meters for that spot.
- Public land: a tapped public land unit's card shows how its ground ranks for deer and turkey, and the Public Lands page has a Habitat column on its Deer and Spring turkey lists in every state, so each unit can be sorted by deer or turkey habitat rank. Premium, with one free sample unit in each state.
- Hunt journal: an entry at a saved spot shows the same meters, so you can see how the ground ranked where you hunted.
What is included in each plan
- Premium: both layers everywhere, at every zoom, plus the meters wherever you click.
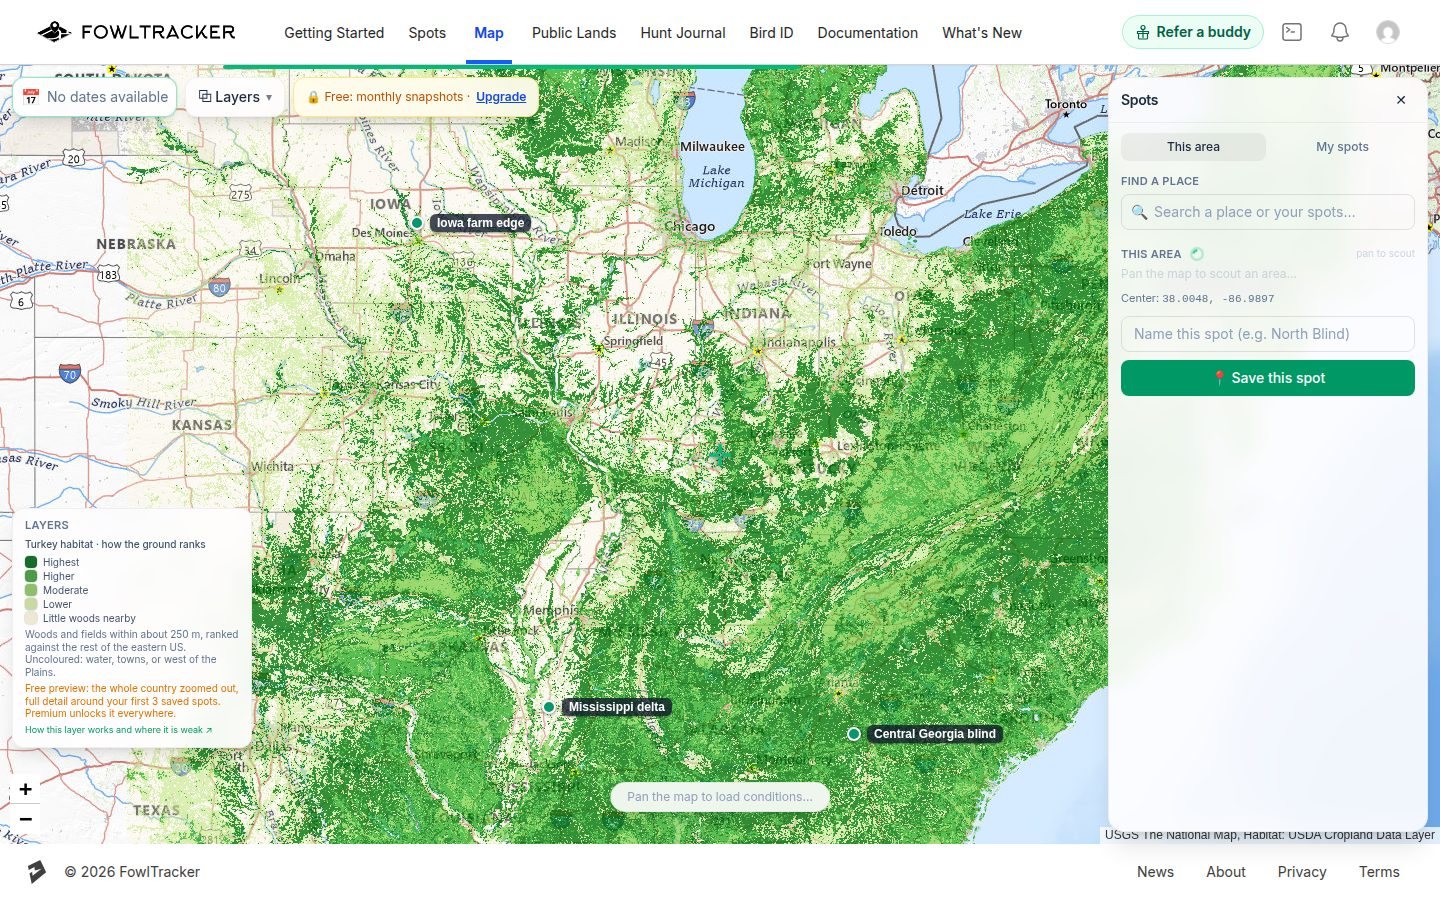
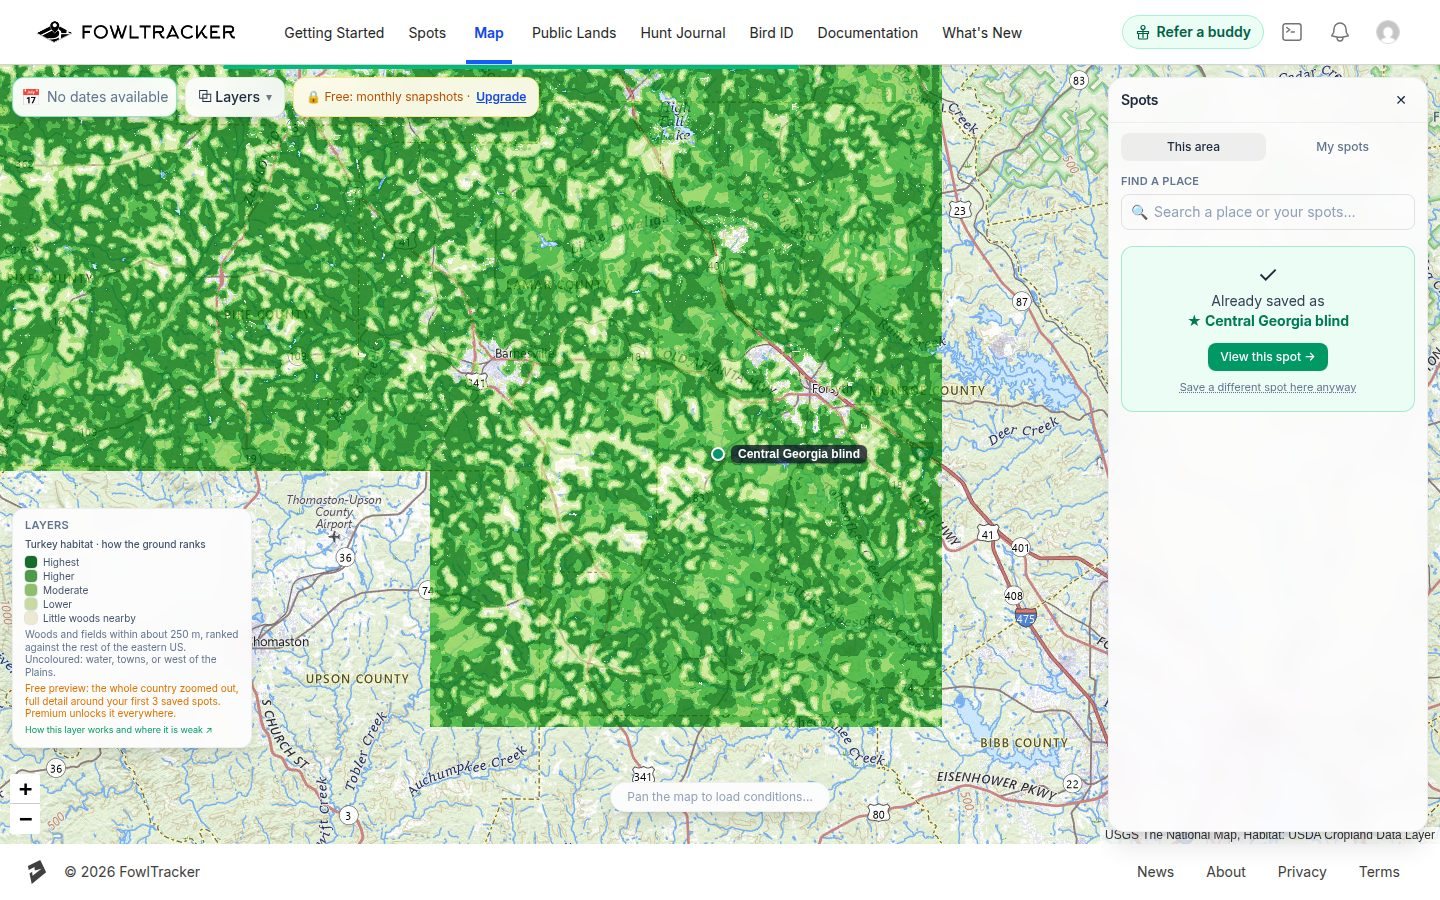
- Free: a preview. The whole eastern US when you are zoomed out to the state scale or wider, and full detail within about 5 km of your first 3 saved spots, so you can see what the layer says about the ground you already hunt.
Known limits
- It ranks cover, not animals. A great-looking square can be empty, and a plain one can hold a good buck.
- The 30 m grid cannot see a creek bottom, a food plot or a bedding thicket by itself.
- Crop years change. A field that was corn last year may be woods-edge hay now.
- West of about longitude −100° (the Plains states) and the arid West are not rated.
Spot something wrong on the ground? Tell us and include the spot's location. That is how the next version improves.