Spot Historical Data
What a saved spot tells you, and what it deliberately doesn't.
Your saved spots live on the Spots board, which is where FowlTracker opens. Each one is a card with a verdict — Active, Light or Quiet — sorted best-first for whatever date you have selected.
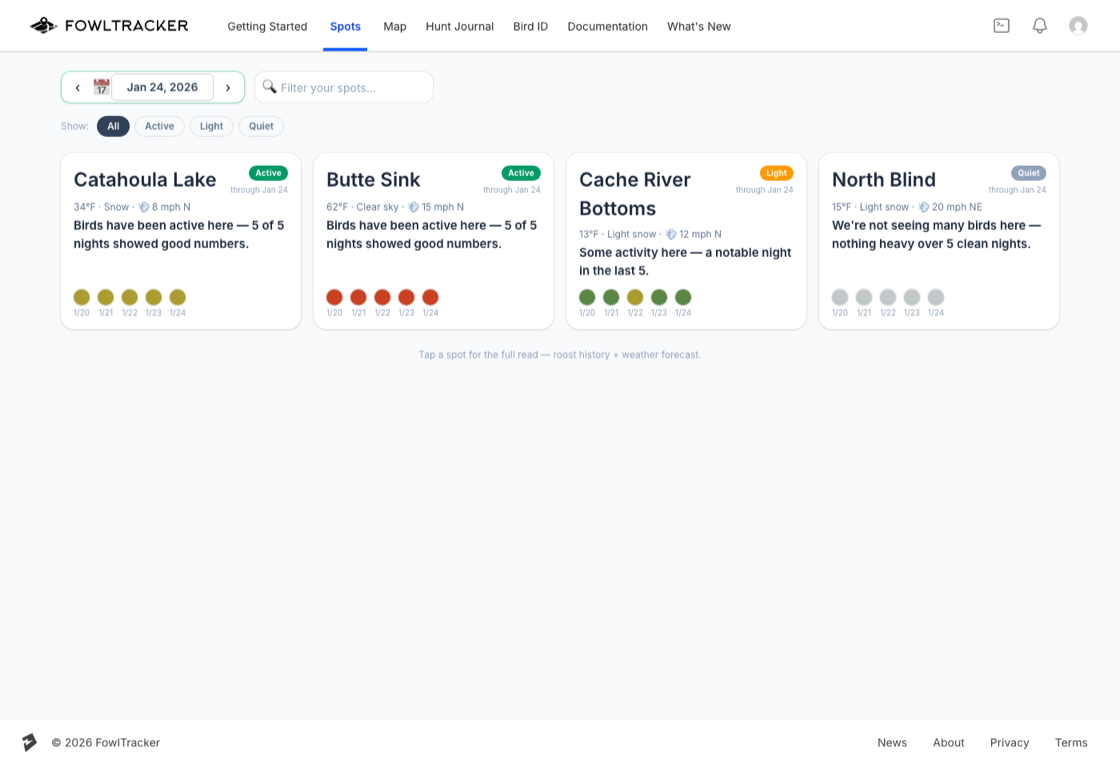
The chip row narrows the board to one verdict, and the filter box searches by name. Tap any card for the full read.
The four panels
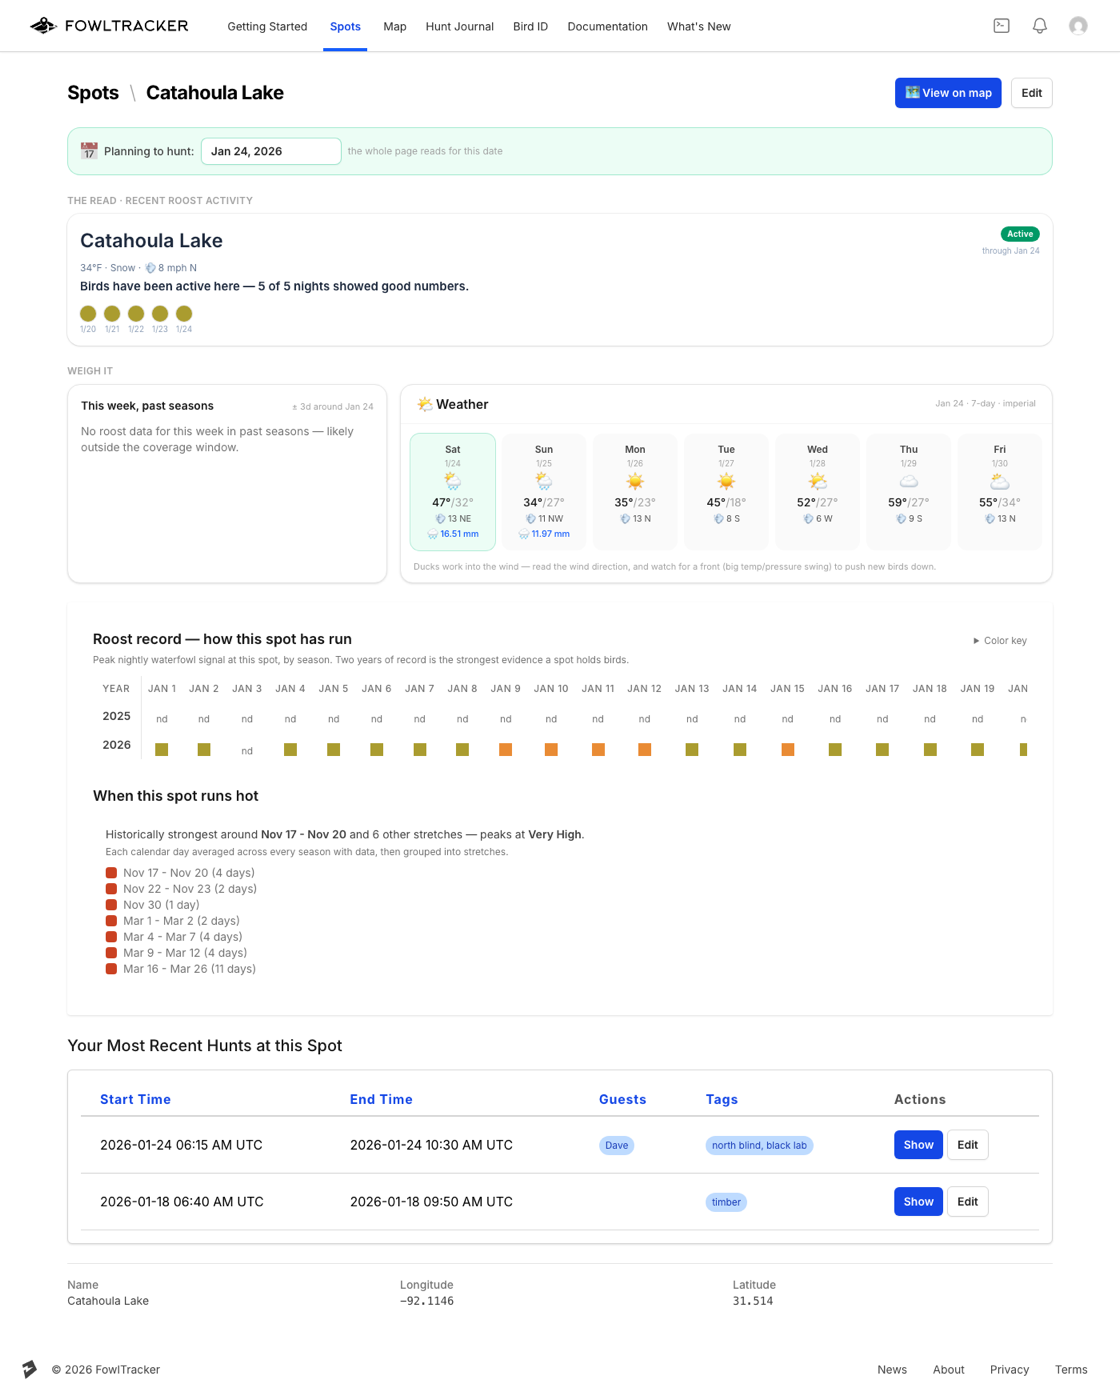
A spot's page is anchored to one date — the Planning to hunt control at the top — and everything below reads for that date. It is laid out in the order you would actually weigh the evidence.
- The read — the last five nights of real roost activity at this spot, night by night. Each dot is one night; hover it for the date and the strength.
- Weigh it — this same week in previous seasons on the left, the seven-day weather forecast on the right. The past-seasons panel is real history; the weather is the only forward-looking thing on the page.
- Track record — two seasons of roost history as a heatmap, plus a When this spot runs hot summary that averages each calendar day across every season with data. This is the panel that tells you whether a spot genuinely holds birds or you got lucky once.
- Your hunts here — everything you have logged at this spot, so your own results sit next to FowlTracker's.
What it is claiming
Every panel except the weather forecast looks backward. FowlTracker is telling you what was recorded on nights that already happened. It does not predict that birds will be there tomorrow, and a spot that has run hot for two seasons can still be empty on the morning you drive out.
Gaps are honest too. A dash instead of a dot means there was no clean reading that night — not that the birds were absent.
On the Free plan the board and the map offer the 1st of each month, and the multi-night roost read and two-season track record are Premium — see Changing the Date.